Create Graph (Draw Menu)
|
|
Create Graph (Draw Menu) |
www.CAD6.com |
|
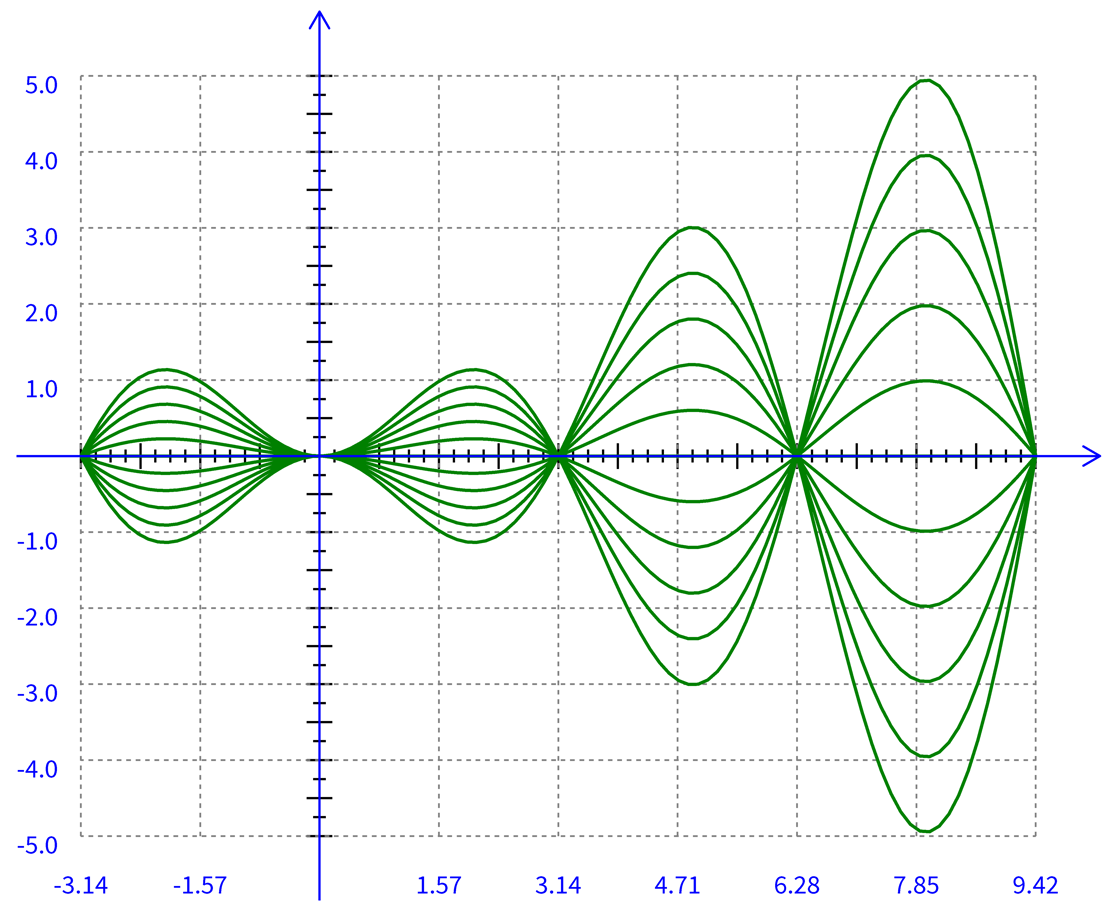
This command lets you generate mathematical function graphs and multi-variable function families as marks, polylines or spline curves. The user can easily enhance these curves by adding a X- and Y-axis and a fully configurable coordinate system with text.
In the first step the function data has to be entered in the "Graph Function" dialog. If X- and Y-axes are needed, their parameters can be edited in the "Graph Axes" dialog. If you wish to generate a family of functions, the additional parameters for the second variable have to be edited in the "Graph Family" dialog.
The two other corners are positioned automatically so that the adjacent sides form right angles.
The generated curve or function is assigned to the layer and pen defined in the parameters dialog.
|
CAD6studio Release 2026.0 - Copyright 2026 Malz++Kassner® GmbH