"Graph Axes" Dialog
|
|
"Graph Axes" Dialog |
www.CAD6.com |
|
How can I access information on this dialog?
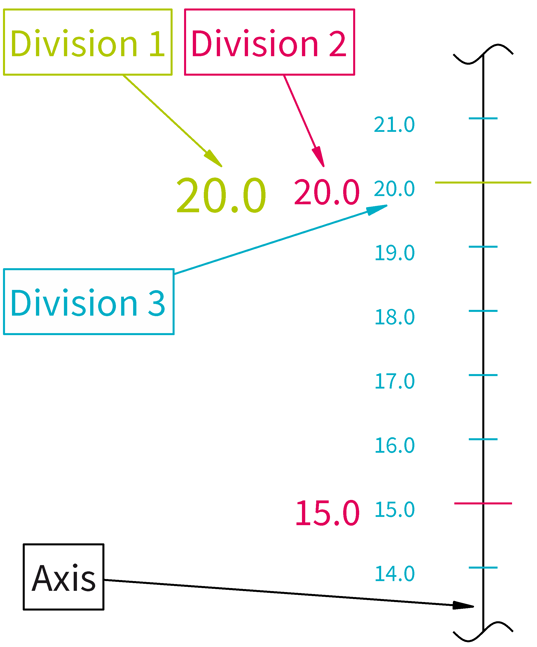
The axes parameters allow the user to enable or disable the X-axis and the Y-axis as well as divisions on these axis separately. Per axis up to 3 levels of division are possible. Every level of division has to be activated first by the checkbox on the left side of the dialog window. In the first edit field the distance between divisions of one level on the axis has to be defined. The following "Pen"-button defines the pen for this level of division. The next edit field defines the length of the division line. This length can be edited in different units. These units can be chosen with the next button in the "Graph Unit" dialog. The description of this dialog window includes further information regarding usage of various length unit types.
Tip: To generate optically pleasant divisions, the biggest division should get the largest division line length.
Every active level of division can contain additional text that shows the value of each division line. This text is activated by clicking on the associated checkbox in this line. The checkbox can only be enabled when the checkbox "Division" in the same line is already active. The button "Font" allows the user to select any available font for each division.
To adjust the distance and position of the text to the axis click on the according "Option"-button. This button supplies the "Graph X-Axis Text" dialog and the "Graph Y-Axis Text" dialog. The user can also define the fractional digits of the dimension text.
If the user wishes to generate a group for each level of divisions, including division lines and division text, the checkbox "Create Group" has to be set. The checkbox "Group Axis" additionally generates a group consisting of the two axis and, if the checkbox is set, the origin marking.
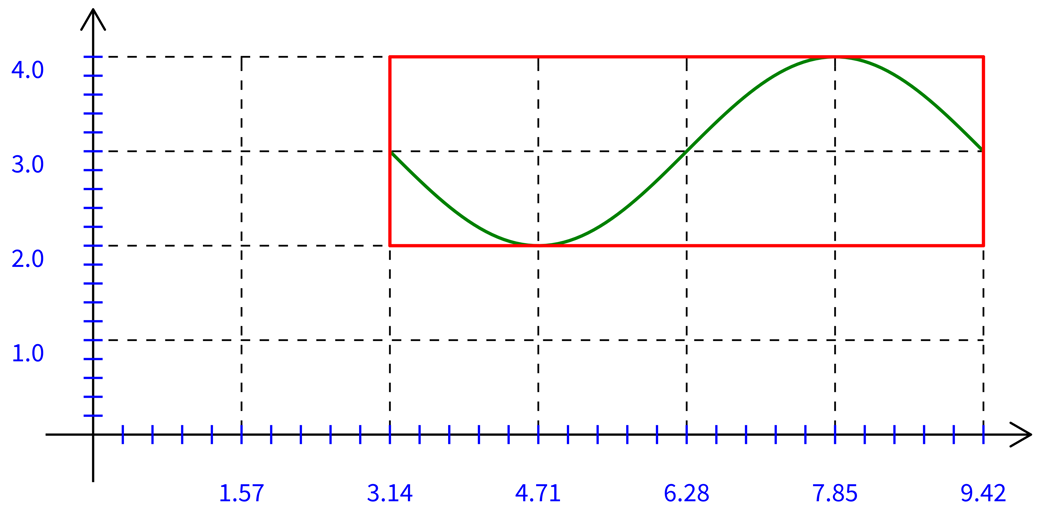
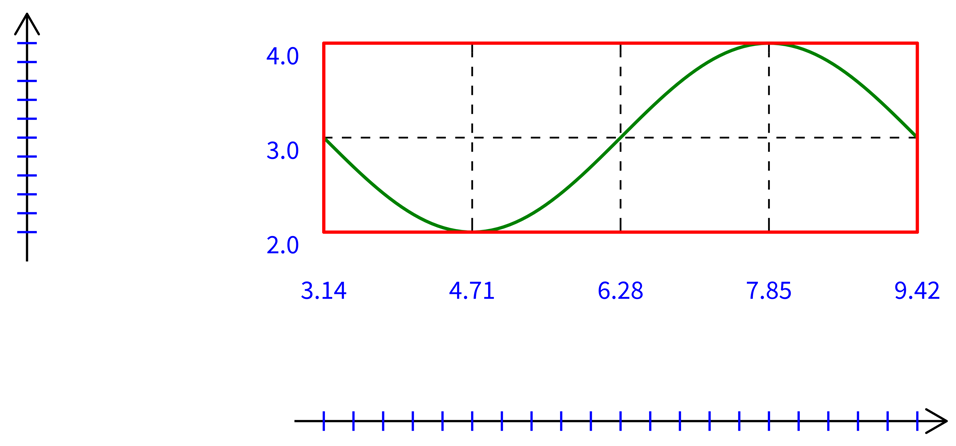
The setting "Ignore Range Violation" can be used if divisions up to the origin are needed, even though the definition range or resulting value range does not reach the origin. This functionality can be helpful to generate a proper background grid for the function. The following examples of the function F(x)=sin(x)+3 show the difference. The red frame displays the rectangle, the user defines where to insert the graph.
Grid with active checkbox "Ignore Range Violation".
Grid with inactive checkbox "Ignore Range Violation".
More information about the generation of a grid with the help of divisions in the description of the "Graph Unit" dialog.
|
CAD6studio Release 2026.0 - Copyright 2026 Malz++Kassner® GmbH